Diagnostics Package (Logs)
Log to File or Log to Console
In the advanced settings ini there are two distinct log output settings:
;enable logging to console
log_to_console=0
;enable logging to file
log_to_file=1
Log Verbosity
Within the advanced settings ini file, the level of verbosity of each log can be configured:
Example:
GENERIC=3,3
LICENSE_MANAGER=3,3
FILE_SINK_ELEMENT=3,3
FILE_SRC_ELEMENT=3,3
| Level | Description |
|---|---|
| 0 | No logging |
| 1 | Warning |
| 2 | Information |
| 3 | Detailed Information (recommended for customers) |
| 4 | Dev level 1 |
| 5 | Dev level 2 |
The higher settings can cause high disk usage. The recommended level for customers is 3.
Log to File
Log to file uses Live Transcoder's logging service. Each element logs to a separate file. The logs are rotated on boot of the host and every 60 minutes. The maximum size by default is 10 GB.
To change the maximum size, add the following environment variable to docker-compose.yml:
TRC_DISK_LOG_LIMIT_MEGABYTES=
Log to Console
Logging output is merged into Journald, which is a system service for collecting and storing log data. It creates and maintains structured, indexed journals based on logging information received from a variety of sources.
The Journal service stores log data persistently in /var/log/journal.
Log to console can be used if you wish to send Live Transcoder logging to an external storage location; however, you must configure journald for this purpose.
Log to File: Diagnostics Package Important Directories and Logs
- The diagnostics package can be downloaded via the UI: Setup > Diagnostics & Support.
- It can be downloaded retrospectively and does not need to be downloaded at the time of the issue. However, if the resolution may require restarting the instance, download the diagnostic package first to preserve logs. Logs are kept for 7 days.
- Within the diagnostics package the following directories are useful for first-line support:
report-YYYY-MM-DD-HH_MM_SS/version/transcoder— transcoder codebase version, OS, and basic system informationreport-YYYY-MM-DD-HH_MM_SS/hwinfo— all hardware informationreport-YYYY-MM-DD-HH_MM_SS/network/ifconfig— host network configurationreport-YYYY-MM-DD-HH_MM_SS/system/timedatectl— timezone the host is configured in (all transcoder logs correspond to UTC)report-YYYY-MM-DD-HH_MM_SS/log/transcoder/*— logs for all pipeline and transcoder services for the last 24 hours; all previous logs are backed up inArchive.zipreport-YYYY-MM-DD-HH_MM_SS/transcoder.tgz/transcoder/pipelines.json— current pipeline configuration at the time the diagnostics package was downloadedreport-YYYY-MM-DD-HH_MM_SS/transcoder.tgz/transcoder/pipelines.json.backup/*— all previous pipeline configuration JSON filesreport-YYYY-MM-DD-HH_MM_SS/transcoder.tgz/transcoder/settings/settings.ini
XXXX-XX-XX_XX_MACHINE_STATUS_Controller_XX.log— Contains CPU, GPU, network utilizationXXXX-XX-XX_XX_UI_XX.log— Contains UI activityXXXX-XX-XX_XX_GENERIC_Controller_XX.log— Contains systemctl activityXXXX-XX-XX_XX_TS_DEMUX_ELEMENT_Demux_XX_XX_XXX.log— Contains per-pipeline demux activityXXXX-XX-XX_XX_TS_MUX_ELEMENT_TsMux_XX_XX_XXX.log— Contains per-pipeline muxer activity
Which Logs Relate to Which Pipeline Components?
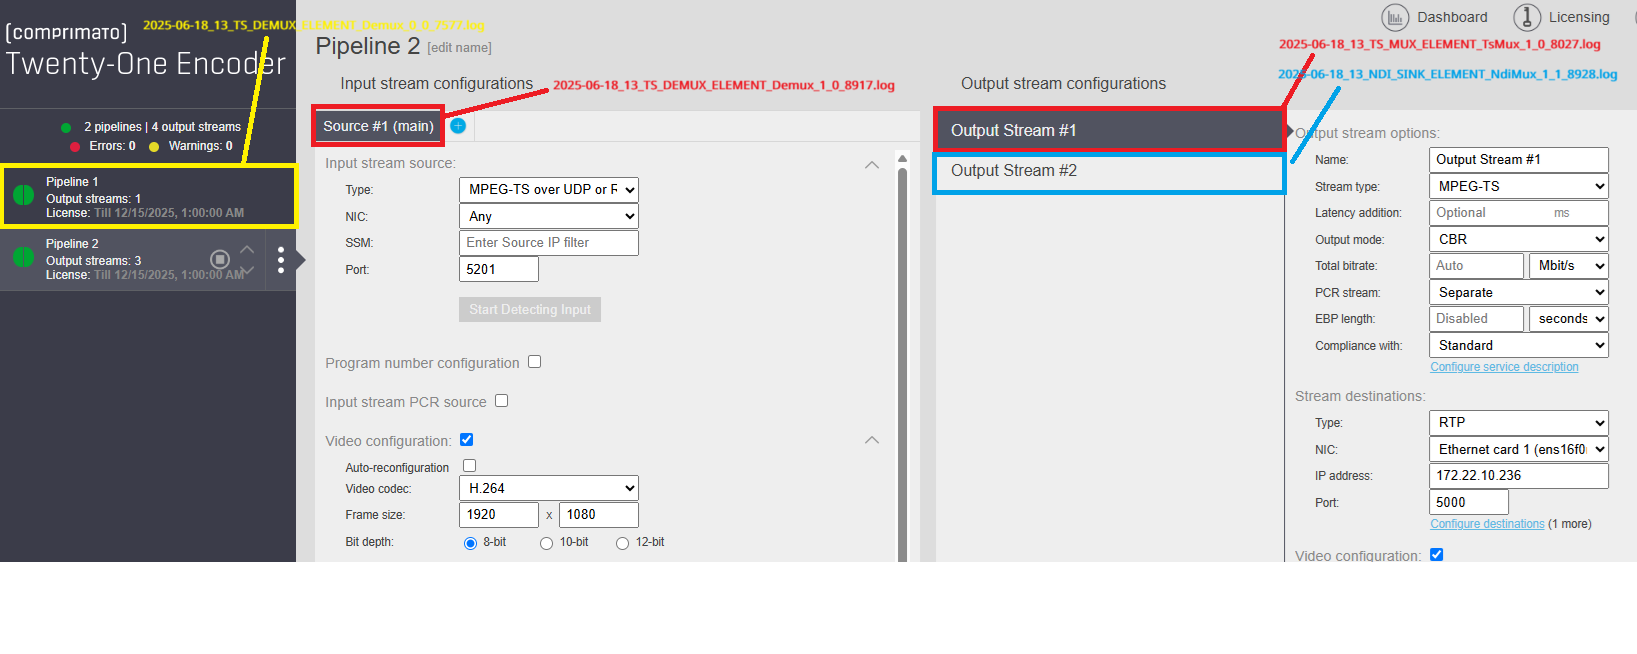
Transcoder logs are found in:
report_live-transcoder-YYYY-MM-DD-HH_MM_SS.tar/log.zip/log/transcoder/transcoder/
YYYY-MM-DD_HH_XX_Demux_0_0_XXXX.log logs relate to the input of the pipeline. The suffix maps the file to a particular pipeline and input (e.g. Pipeline ID: 0, Source 0).
YYYY-MM-DD_HH_mux_0_0_XXXX.log logs relate to the output of the pipeline (e.g. Pipeline ID: 0, Output 0).
The last digits describe the process ID as managed by the OS. Each time the pipeline restarts or stops/starts, each process will restart and assume a new process ID.
Examples of Common Errors, Statistics and Warnings
MPEG-TS (SRT, UDP, RTP)
Demuxer detected a continuity counter error — either a count was skipped or duplicated. This can occur during encoding or transport. Inspect the stream origin and any devices/links it transits. A third-party device that detects CC errors is useful for determining the origin:
Nov 25 11:27:12 transcoder0 transcoder-base[772]: 11:27:12.413 TS_DEMUX_ELEMENT PidHandler.cpp:31 Demux_0_0(772) H264 elementary stream pid: 101 Detected packet drop (mismatch in CC)
TS muxer is dropping a packet — the buffer may have been starved due to input issues, insufficient compute resource, or insufficient time relative to PTS:
Nov 25 13:51:35 transcoder0 transcoder-base[609]: 13:51:35.188 TS_MUX_ELEMENT TsMuuxElement.cpp:1023 TsMux_1_0(609) PID: 101 drop packets: 94
TS demuxer reports PCR from source:
Nov 25 13:51:35 transcoder0 transcoder-base[589]: 13:51:35.212 TS_DEMUX_ELEMENT PcrState.cpp:501 Demux_0_0(589) PCR report: Latest PCR (27MHz): 291811910657 [ a = 0.999932 , b = 2.90792e+11 ] Discontinuities: 0 PCR-day: 0
SRT
SRT pipeline configuration applied:
Nov 25 10:52:09 transcoder0 transcoder-base[385]: 2024-11-25 10:52:09 [http-nio-127.0.0.1-8080-exec-2] INFO c.c.t.ui.type.ConfigurationSession - PIPELINE_MODEL_APPLIED: Pipeline (id:64, name: Pipeline) inputs: source: udp://0.0.0.0:5100 srt: Srt{mode=LISTENER, latency=240, overhead=20, streamID=, isEncrypted=false, encryption=AES_DEFAULT, passphrase=}
SRT Receiver (Demuxer) in Listener mode:
Nov 25 10:52:49 transcoder0 transcoder-base[762]: 10:52:49.598 TS_DEMUX_ELEMENT TsDemuxElement.cpp:279 Demux_0_0(762) SRT Listening
SRT Listener is functioning but no device is currently connecting on the specified address/port (also occurs at pipeline start or during continuous packet loss):
Nov 25 11:00:42 transcoder0 transcoder-base[322]: 11:00:42.547603/CMPTO_NET_INIT*E:SRT.cn: srt_accept: no pending connection available at the moment
Nov 25 11:01:57 transcoder0 transcoder-base[954]: 11:01:57.611  TS_MUX_ELEMENT          Sender.cpp:212     TsMux_1_0(954)    SRT connection failed. Trying again. srt://127.0.0.1:5050:lo Error:  5
SRT NAK (packet retransmit request / drop):
Nov 25 11:26:49 transcoder0 transcoder-base[772]: 11:26:49.906758/SRT:TsbPd!W:SRT.br: @910563377: RCV-DROPPED 2 packet(s). Packet seqno %900016611 delayed for 0.084 ms
Nov 25 11:26:15 transcoder0 transcoder-base[772]: 11:26:15.345  TS_DEMUX_ELEMENT        PidHandler.cpp:31      Demux_0_0(772)    H264 elementary stream pid: 101 Detected packet drop (mismatch in CC)11:26:15.345412/SRT:TsbPd!W:SRT.br: @910563377: RCV-DROPPED 1 packet(s). Packet seqno %899988020 delayed for 0.452 ms
NDI
Start of NDI Output stream:
Nov 25 10:58:17 transcoder0 transcoder-base[92]: 10:58:17.319 NDI_SINK_ELEMENT NdiSinkElement.cpp:595 Controller(92) Adding video stream to NDI Sink element.
NDI Receiver starts receiving NDI video:
Dec 05 13:35:31 transcoder0 transcoder-base[1142]: 13:35:31.468 NDI_SRC_ELEMENT NdiReceiver.cpp:52 NdiSrc_13_0(1142) Receiving audio/video with frame rate: 50
Transcode latency report (average and maximum latency over a period):
Nov 25 11:01:40 transcoder0 transcoder-base[780]: 11:01:40.341 LATENCY_MEASUREMENT NdiSinkElement.cpp:524 NdiMux_0_0_0(780) NdiMux_0_0_0 Latency: 2810.88 avg, 2864.5 max
Start of NDI Input stream:
Dec 05 13:35:27 transcoder0 transcoder-base[1142]: 13:35:27.642 NDI_SRC_ELEMENT NdiSourceElement.cpp:133 NdiSrc_13_0(1142) Looking for NDI source 'TRANSCODER0 (zz_12345)'
NDI sink element (NDI Output) has encountered a missing frame from the input — PTSJitterRemover logs this warning when the PTS expected value exceeds 1800/90KHz = 20 ms (one frame for 50 Hz video):
Dec 05 13:38:51 transcoder0 transcoder-base[1140]: 13:38:51.345 NDI_SINK_ELEMENT PtsJitterRemover.cpp:33 NdiMux_12_0_0(1140) PTSJitterRemover resetting due to diff > maxPTSJitter: 1800 > 9